Compare income tax in every state
The same salary run through every state's own rules, ranked — and the property tax side that decides whether the ranking means anything.
 Written and edited by Pablo Ruiz QuinteroSources checked September 1, 2026Every figure checked against the authority that sets it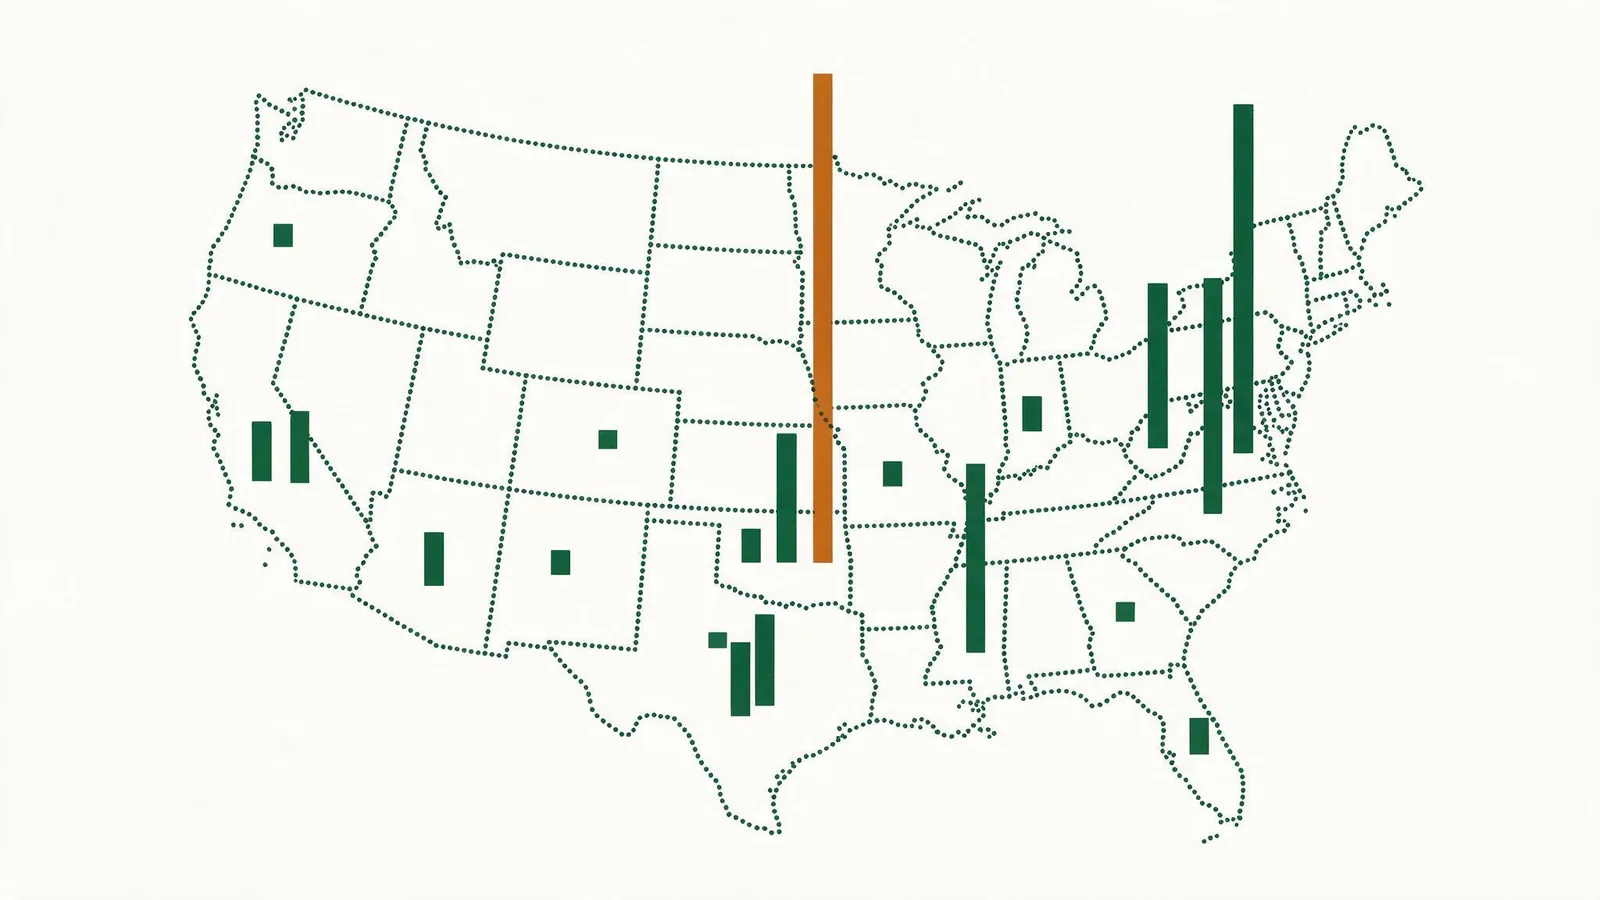
The same salary, ranked across all fifty-one
Federal tax is identical everywhere: $9,870 of income tax and $6,503 of FICA on $85,000 single, in every state alike. Only the state layer varies, and it varies from $0 to $5,835.
9 states take nothing. The median state takes $3,032. At the top, Oregon takes $5,835 — 6.87% of gross, about $486 a month.
Among the states that do tax income, the cheapest is North Dakota at $377 and the range up to the top is $5,458. There is no cluster in between — the distribution is genuinely spread, which is why an "average state income tax" is not a number worth quoting.
The gap compounds. $2,804 a year between the dearest state and the median is $28,037 over a decade at this salary alone, before any raise — and considerably more if your income grows, because most of the expensive states are graduated.
That said, this table alone decides nothing, and the sections below are the reason. Every state raises what it needs somehow, and the ones that take nothing here take more somewhere else.
The ranking is different at a different salary
A "cheapest states for taxes" list is only ever true at the income it was computed for, because the three systems behave differently as income rises.
13 states apply a single flat rate, so their tax is a constant proportion at every income. 29 run graduated brackets, so their share rises with income. A flat state that looks expensive to a modest earner looks cheap to a high one, and a graduated state does exactly the reverse.
Concretely: on $45,000 the dearest state takes $2,819, which is 6.26% of gross. On $250,000 the dearest takes $22,705, or 9.08% — a materially higher share, and not necessarily the same state.
Filing status moves it too. Several states do not double their brackets and deduction for joint filers, which produces a marriage penalty that is invisible in any single-filer comparison — and a few do the reverse.
Exempt bands are the other thing a rate table hides. Ohio and Mississippi both publish what looks like a flat rate but tax nothing below a threshold, which makes them effectively two-bracket systems and much cheaper at low incomes than their headline rate implies.
The comparison that actually decides a move
Income tax is one of three or four ways a state funds itself, and looking at one of them reliably produces the wrong conclusion. A state taking nothing from your salary raises the money from property, sales, or a natural-resource base instead.
Property tax is the biggest of the offsets. The national median county effective rate is 0.84%, and the range runs from 0.08% to 3.64%. On a $400,000 home, a rate one percentage point above the median costs $4,000 a year — which cancels most of the income tax saving at this salary on its own.
Sales tax is the least visible and the most regressive: unavoidable, charged on spending rather than earning, and therefore heaviest on households that spend most of what they earn. It reverses the ranking entirely at modest incomes in several comparisons.
Then the local income tax layer that almost nothing models. Eleven states let a city, county or school district levy their own, and we model 3,672 such jurisdictions across 7 states. In several of those places the local tax exceeds what the state takes from a modest salary.
And housing cost, which is not a tax and is usually larger than all of them. The honest comparison is total tax on your actual income plus total tax on your actual housing, in both places — which is what having both halves of this site is for.
Moving is not the same as changing your tax state
Leaving a state does not end its claim on income earned there, and several states apply day-count and domicile tests aggressively to people who keep a house, a licence, a business or a family behind.
Working across a state line generally means the state where the work is performed taxes that income, with a credit in your home state. That produces two returns and, occasionally, a combined total higher than either state alone would have charged — reciprocity agreements exist between some neighbouring states and remove it, but they are specific pairs rather than a general rule.
A move part-way through the year usually means part-year returns in both states, each taxing the income earned while you were resident. The apportionment is factual rather than optional, and a large one-off item — a bonus, an option exercise, a property sale — is allocated by when it was received rather than by where you ended the year.
Remote work has made this considerably messier. Some states tax income earned by a non-resident working for an in-state employer regardless of where the work happened, which can produce a liability in a state you have never set foot in.
The practical advice is dull and correct: if a move is motivated by tax, the timing of large income items relative to the move is usually worth more than the move itself, and it is worth confirming both states' rules before rather than after.
Why these numbers differ from other comparison tables
Most state comparison tables list a top marginal rate. That figure tells you almost nothing about what anyone pays, because it ignores the deduction, the exemptions, the credits, the exempt band and where the brackets actually sit.
The figures here are computed rather than listed: each state's own rules applied to the same salary, producing the tax a person would actually owe. That is why some states appear cheaper here than their headline rate suggests and some appear dearer.
Each state's rules were read off that state's own department of revenue publication, one state at a time. Of 42 reviewed, 22 carried a wrong rate, threshold or credit in the compiled sources everyone uses — including one where the error overstated the bill by 43%.
Every state page carries the document its figures came from and the date they were checked, and says plainly where a figure has not yet been read off a primary source. A comparison table without dates is comparing states as they were at unknown and possibly different times.
Which matters more here than almost anywhere, because state rates change on state calendars and frequently backdate. A comparison compiled in spring can contain figures from three different legislative moments without any indication of it.
Working in one state and living in another
The general rule is that the state where the work is physically performed taxes the income, and your home state taxes it too but gives a credit for what the other state took. The credit normally prevents double taxation, and normally is doing work in that sentence.
The credit is usually limited to what your home state would have charged on the same income. Where you work in a higher-rate state, the excess is not recovered — so the combined bill is the higher of the two rather than either one, and living in a low-tax state while working in a high-tax one saves less than it appears.
Reciprocity agreements between specific neighbouring states remove this entirely: you file only at home and the work state withholds nothing. They are bilateral, they cover particular pairs, and they usually require filing a form with the employer to activate. Assuming one exists because two states are adjacent is a common and expensive mistake.
Remote work has made this considerably messier. Some states tax income earned by a non-resident working for an in-state employer regardless of where the work physically happened, which can create a liability in a state you have never visited.
The practical step is to check both states' rules before accepting a cross-border role, and to check whether the employer will withhold for the right one. Employers frequently withhold for the state where their office is, which is not always the state that should be taxing you.
Five things a state ranking cannot show
Local income tax. Eleven states permit it and the ranking is on state tax alone. A resident of a city that levies its own can pay more in total than someone in a higher-ranked state without one.
Retirement income treatment. Several states tax wages fully while exempting pensions and retirement withdrawals entirely, which reverses the ranking for anyone retired. A comparison computed on salary says nothing about them.
Marriage treatment. Some states do not double their brackets and deduction for joint filers, producing a marriage penalty invisible in a single-filer comparison — and a few do the opposite.
Property and sales tax. The largest offsets, and structurally related: the states taking least here take most somewhere else, because the money has to come from somewhere.
Credits. State earned income credits, child credits, property tax circuit-breakers and renter's credits change the effective rate substantially at lower incomes, and few are visible in a rate-based ranking.
How to use a ranking without being misled by it
Run it at your own salary rather than reading a general list. The ordering genuinely changes across the income range, because flat and graduated systems cross over — a list computed at $50,000 answers a different question from one computed at $250,000.
Run it at your own filing status too, for the same reason: the states that do not double their brackets for joint filers move in the ranking when you switch.
Then look up the specific county you would live in on the property side. Within a single state, county rates commonly vary by a factor of two or more — which is frequently larger than the difference between the states you are comparing.
Add sales tax if you spend a large share of what you earn, because it is the tax that reverses conclusions at modest incomes and it never appears in an income tax ranking.
And check the local income tax layer for the specific city, not the state. 42 states levy income tax and eleven allow a city or county to add to it, and the city-level figure is the one that decides your actual bill.
The order to check things in before a move
Take-home in both places at your actual salary and status. Gross minus federal, FICA, state and any local income tax. That is the figure the ranking above produces, and it is the starting point rather than the answer.
The specific county's property rate, not the state average. Within a state, county effective rates commonly vary by a factor of two or more, and the spread inside one state frequently exceeds the difference between the two states you are comparing.
Sales tax, if you spend most of what you earn. Combined state and local rates in a given city, applied to your actual spending. It is the tax that reverses conclusions at modest incomes.
Housing cost, which is not a tax and is usually larger than all of them. A $5,835 state income tax saving is erased by $486 a month of additional rent.
Residency mechanics. Whether you will genuinely be resident, whether you will work across a state line, and how a part-year move apportions any large one-off income. The timing of a bonus, an option exercise or a property sale relative to the move is frequently worth more than the move itself.
Why these figures are computed rather than listed
Almost every state comparison you will find lists a top marginal rate, because that is a single number that can be typed into a table. It is also close to useless for predicting what anyone pays.
A state with a high top rate that begins at a very high income is cheap for ordinary salaries. A state with a modest flat rate and no deduction can be dearer at $45,000 than a graduated state with a top rate twice as high. The ranking by headline rate and the ranking by actual tax are different lists.
So each figure here is produced by applying that state's own rules — its deduction, its exemptions, its brackets, its exempt band where it has one, its credits — to the same salary. That is the only construction that makes a comparison meaningful.
It also exposes things a rate table cannot. Ohio and Mississippi both publish what looks like a flat rate and tax nothing below a threshold; treating them as flat from the first dollar overstated an Ohio bill by 43% in the sources we checked, and a computed comparison simply does not make that error.
Every state's rules were read off that state's own department of revenue publication with the date recorded, and each state page says which document and when. A comparison without dates is comparing states as they were at unknown and possibly different moments.
Where the figures in this guide come from
Every number above comes from each state's own department of revenue publication and IRS Rev. Proc. 2025-32, § 3.01, Tables 1-4, read off the document itself rather than off a summary of it. The property rates are effective rates from the Census American Community Survey — median tax actually paid over median home value — which is the only property figure comparable across state lines.
That distinction is not pedantry. When we audited this category in August 2026, sites ranking on the first page for "2026 income tax calculator" were publishing a standard deduction of $15,200 single — the previous year's figure — while linking to the correct IRS page from the same screen.
State figures were read one state at a time off each department of revenue's own publication. Of 42 states reviewed, 14 matched the compiled sources everyone uses and 22 did not. The errors were overwhelmingly about timing rather than structure: rates superseded by legislation passed after the compilation, several of them backdated to 1 January.
So each figure on this site carries the document it came from and the date it was checked, and where something has not yet been read off a primary source the page says so rather than implying it has. "We have not looked" and "it does not exist" are different claims, and only one of them is a reason to stop looking.
The check we would suggest running on anything you read about state tax comparisons, here included: find the underlying figure, and compare it against the source it claims to come from. It takes two minutes and it settles the question that no amount of confident writing can.
The comparison in five numbers
$0 to $5,835. The range of state income tax on $85,000 single. That is the entire variation between states, because federal tax and FICA are identical everywhere.
$3,032. What the median state takes on the same salary — a useful anchor, and a reminder that the extremes are not typical of anywhere.
9, 13, 29. States with no income tax, with a flat rate, and with graduated brackets. The three groups behave differently as income rises, which is why any ranking is specific to the salary it was computed at.
0.84%. The national median county property tax rate — $3,348 a year on a $400,000 home. The counties at the tenth and ninetieth percentiles are 0.46% and 1.57%, a spread of $4,446 a year on the same house.
3,672. Local income tax jurisdictions modelled here, across 7 states. In several of them the city takes more from a modest salary than the state does, and almost no national comparison includes any of it.
Where to go next
Questions
- Which state has the lowest income tax?
- 9 states charge none at all: Alaska, Florida, Nevada, New Hampshire, South Dakota, Tennessee, Texas, Washington, Wyoming. Among states that do tax income the ranking depends on your salary, because flat and graduated systems cross over — a state that is cheap at $45,000 is not always cheap at $250,000.
- How much does state income tax vary?
- On $85,000 single it runs from nothing to $5,835 — 6.87% of gross in Oregon. The median state takes $3,032. Federal tax and FICA are identical everywhere, so the state layer is the entire difference.
- Is a state with no income tax cheaper overall?
- Not necessarily, and often not. Every state raises what it needs somehow — usually property tax, sales tax, or a resource base. Several no-income-tax states sit well above the national median county property rate of 0.84%, and on a $400,000 home one percentage point above the median costs $4,000 a year.
- Does moving states change my tax immediately?
- Not automatically. A part-year move usually means returns in both states, apportioned by when income was received. And leaving does not end a state's claim on income earned there — states apply day-count and domicile tests, particularly where a house, a licence or a business stays behind.
- Do cities charge income tax too?
- In eleven states, yes. We model 3,672 local jurisdictions across 7 states — every Pennsylvania municipality, every Ohio municipality and school district, Indiana's counties, Maryland's counties, Michigan's cities and New York City. In several the local tax exceeds what the state takes from a modest salary.
- Why do your figures differ from other comparison tables?
- Most tables list a top marginal rate, which ignores the deduction, exemptions, credits and where brackets sit. These are computed: each state's own rules applied to the same salary. And each state was read off its own department of revenue — 22 of 42 carried a wrong figure in the compiled sources.